Animate-graph Documentation
Create clear, step-by-step visualizations to enhance your teaching and explanations in Reveal.js without any coding knowledge. By defining HTML elements with specific attributes, such as divs and spans, users can specify data and customize visual elements. The package automatically converts these elements into SVG elements using D3.js, enabling smooth transitions and animations. It can plot curves, points, and filled areas along with annotations and animate their transitions (position or appearance) synchronized with Reveal.js fragments. All you need to know is how to add divs and spans in your Quarto document.
You can check the minimal example or documentation slides.
Key Features:
- Simplified integration with Reveal.js presentations.
- No coding required; users define visual elements using HTML attributes.
- Supports step-by-step animations and transitions.
- Plots curves, points, filled areas, and annotations.
Installing
TODO: Replace the <github-organization> with your GitHub organization.
quarto add <github-organization>/animate-graph-revealjsThis will install the extension under the _extensions subdirectory.
Enabling
This package depends on D3.js; it must be loaded along with the plug-in utilizing include-in-header. To use the extension, add the following to your document’s front matter:
format:
  revealjs:
    include-in-header:
      - text: '<script src="https://cdn.jsdelivr.net/npm/d3@7"></script>'
revealjs-plugins:
  - animate-graph
If you want to render math expressions, you also need to use Katex for the math method:
format:
  revealjs:
    html-math-method: katex
Basic Usage
- There are four main components of this plug in:
graph,element,move, andsetAttribute.
- To generate an animated graph:
- Create a div with class animategraph.
- Create a span within
div.animategraphwith class addElement to add an element. - Create a span within
div.animategraphwith class move to change the position of an element. - Create a span within
div.animategraphwith class setAttribute to the appearance of an element.
:::{.animategraph}

[]{.addElement required-attributes}
[]{.move required-attributes}
[]{.setAttribute required-attributes}

:::- The plug in comes with a predefined data named
econ.- It is the default data for the graph.
- See
econDataset section below for the list of variables available.
- See
- To
define anew data, please see Defining Data section below.
- It is the default data for the graph.
A Basic Usage Using the Default Data
- Define a div with class animategraph.
:::{.animategraph}

:::- Define an element within this div using the following template (all fields are required, except id):
- For
line:
[]{ .addElement type='line' var-x='name of the variable x' var-y='name of the variable y' id="name of the element"}- For
point:
[]{ .addElement type='point' var-x='x coordinate' var-y='y coordinate' id="name of the element"}- For
area:
[]{ .addElement type='area' var-x='name of the variable x' var-y='name of the first y variable; name of the second y variable' id='name of the element'}- For
text:
[]{ .addElement type='text' var-x='x coordinate' var-y='y coordinate' text='text to be printed' id='name of the element'}- For
ticks:
[]{ .addElement type='tick' var-x='position of ticks on x axis' label-x='text to be printed on these positions' var-y='position of ticks on x axis' label-y='text to be printed on these positions' id="name of the element"}- There are few alterations to these required fields, which explained in below.
- Id is not required to generate an element, but it is required to change position or appearance.
- Specify a movement within
div.animategraphusing the following template (all fields are required):
[]{ .move var-x='new x variable' var-y='new y variable' index='when the action will happen' id="name of the element"}- Specify a change in appearance within
div.animategraphusing the following template:
[]{ .setAttribute attributeA="value of attribute A" style="css style" index='when the change will happen' id='name of the element'}Minimal Example
:::{.animategraph}

[]{ .addElement type='line' var-x='quantity' var-y='supply'  }
[]{ .addElement type='line' var-x='quantity' var-y='demand' id='demand' index=0 }
[]{ .addElement type='point' var-x='2.5' var-y='2.5' id='equilibrium' index=1   lines="true" }
[]{ .addElement type='tick' var-x='2.5' label-x="$q^\\star$" var-y='2.5' label-y="$p^\\star$"  index=2 }
[]{ .addElement type='area' var-x='quantity' var-y0='supply' var-y1='demand' index=3 id='surplus'  }
[]{ .addElement type='text' var-x='1' var-y='2.5' text="Total Surplus" index=3   }
[]{ .move var-x='quantity' var-y='demand_right' id='demand' index=4  }
[]{ .move var-x='3' var-y='3' id='equilibrium' index=5  }
[]{ .addElement type='tick' var-x='3' label-x="$q^{\\star}_{new}$" var-y='3' label-y="$p^\\star_{new}$"  index=6 }
[]{ .move id='surplus' var-x='quantity' var-y0='supply' var-y1='demand_right' index=7  }

:::
Details
Defining Data
Attach data to a graph
New data can be attached to the graph using the df attribute.
:::{.animategraph df='[{x:0, y:0}, {x:1, y:1}]' }
:::
In R, you may utilize toJSON function from jsonlite package to convert your data frame to array of JS objects. Notice single quote before and after the inline code.
:::{.animategraph df='`{r} jsonlite::toJSON(df)`' }
:::
If you are planning to use it on other graphs, then you may assign a name by specifying the df-label attribute.
:::{.animategraph df='[{x:0, y:0}, {x:1, y:1}]' df-label="data" }
:::
Attach data to an element
A new data can be attached to an element by data-df attribute. This data can only be used for the specific element.
:::{.animategraph }
![]{ .addElement df='`{r} jsonlite::toJSON(df)`' var-x="x" var-y="y" }
:::
Define using JavaScript
Datasets are stored in a JS object named animateGraphData. You may directly assign new data directly to it. But first, you need to initialize it, because the code runs after slides are generated. You need to initialize it at the beginning of your document, so that other datasets remains.
```{js}
var animateGraphData = [];
animateGraphData['name of new data'] = [{x:0, y:0}, {x:1, y:1}];
```
Properties of div.animategraph
div.animategraph.:::{.animategraph} \n :::
Required fields
- There is no required field for
div.animategraph.
Optional Fields
| Attribute | Input | Definition | Default |
|---|---|---|---|
id
|
String. | Id of the graph. | - |
style
|
Array | CSS styling to apply graph div. Useful for setting width and height. | width:100%; height:100% |
df
|
Array of JS Object | Data to be used for graph elements. | - |
df-label
|
String. |
Two possibilities:
|
econ |
var-x var-y
|
String. | Variable names available in df to determine the axis domain. |
Variable of the first line. If it is not defined, then the variable names of df-label.
|
range-x range-y
|
Numeric array. | Semicolon separated (or comma separated) two numeric values. To set the range of x and y axes. |
the minimum and maximum of var-x and var-y.
|
label-x label-y
|
String. | Axis labels. | - |
title
|
String | Title of the graph. | - |
legend
|
Boolean | If true, the legend will be added. | false |
ticks
|
Boolean | If true, default ticks will be added. | true |
Common Properties of addElement
span.addElement.[]{.addElement type required-fields-of-type optional-fields}.
Required Fields
| Attribute | Input | Definition |
|---|---|---|
type
|
String |
Type of the element. Possible values: line, points, area, text, tick.
|
var-x var-y
|
String, numeric, or array | Definition depends on the type. See detailed definition for each type below. |
Optional Fields
| Attribute | Input | Definition | Default |
|---|---|---|---|
id
|
String. | Id of the element. Required if it will be referred later. | - |
data-*
|
Various | Attributes to be passed to svg element for styling (color, width, etc.). | - |
index
|
Integer | Fragment index when the element becomes visible. | - |
index-out
|
Integer | Fragment index when the element becomes hidden | - |
df
|
Array of JS Object | Data for this specific element. | - |
df-label
|
String. | Name of the data to be used. |
Inherited from div.animategraph.
|
line
span.addElement[type='line'].[]{.addElement type='line' var-x var-y optional-fields}.
Additional Required Fields
| Attribute | Input | Definition |
|---|---|---|
var-x var-y
|
String, numeric, or array |
One of the three possibilities:
|
Additional Optional Fields
| Attribute | Input | Definition | Default |
|---|---|---|---|
label
|
String | Name of the line appears on the legend. Default is the id of the element. | - |
showlegend
|
Boolean | If true, it will added to legend (conditional on legend=‘true’ for the graph. | true |
point
span.addElement[type='point'].[]{.addElement type='point' var-x var-y optional-fields}.
Additional Required Fields
| Attribute | Input | Definition |
|---|---|---|
var-x var-y
|
String, numeric, or array |
One of the two possibilities:
|
Additional Optional Fields
| Attribute | Input | Definition | Default |
|---|---|---|---|
lines
|
Boolean. | If true, then projection lines on \(x\) and \(y\) axes are drawn. | false |
area
span.addElement[type='area'].[]{.addElement type='area' var-x var-y optional-fields}.
Additional Required Fields
| Attribute | Input | Definition |
|---|---|---|
var-x
|
String | A variable name in df. |
var-y
|
String array, or numeric array. |
Semicolon separated two values. One of the three possibilities:
|
Additional Optional Fields
| Attribute | Input | Definition | Default |
|---|---|---|---|
range-x
|
Array |
Semicolon separated two values. Limits on the x-axis to fill. Two possibilities:
|
Intersection; left |
text
span.addElement[type='text'].[]{.addElement type='text' var-x var-y text optional-fields}.
Additional Required Fields
| Attribute | Input | Definition |
|---|---|---|
var-x var-y
|
Numeric. | Coordinates for the text element. |
text
|
String | Text to be printed on the graph. |
Additional Optional Fields
| Attribute | Input | Definition | Default |
|---|---|---|---|
style
|
Array |
Semicolon separated CSS styling to be assigned directly to style attribute.
|
- |
anchor-x
|
String |
The side of the element reference to var-x. Possible values: left, right, middle. |
middle |
anchor-y
|
String |
The side of the element reference to var-y. Possible values: top, bottom, middle. |
middle |
vertical
|
Boolean | If true, the text will be printed vertically, | false |
tick
span.addElement[type='tick'].[]{.addElement type='tick' var-x var-y label-x label-y optional-fields}.
Additional Required Fields
| Attribute | Input | Definition |
|---|---|---|
var-x var-y
|
Numeric array. | Values for the position of ticks on x and y axes, respectively. |
label-x label-y
|
String | Labels to be printed on values. |
Additional Optional Fields
| Attribute | Input | Definition | Default |
|---|---|---|---|
style
|
Array |
Semicolon separated CSS styling to be assigned directly to style attribute.
|
- |
Properties of move
span.move.[]{.move id var-x var-y index optional-fields}.
Required Fields
| Attribute | Input | Definition |
|---|---|---|
id
|
String | the id of the element to be moved. |
var-x var-y
|
String or numeric | New position of the element. |
index
|
Numeric | Fragment when the movement will happen. |
Optional Fields
| Attribute | Input | Definition | Default |
|---|---|---|---|
duration
|
Numeric | The duration (speed) of the animation | 2000 |
df
|
Array of JS Object | New data to be used for the transition. | |
df-label
|
String | Data to be used. |
Previous df-label
|
clone
|
Boolean | If true, a copy of the original element is generated and the new element is moved. | False |
Properties of setAttribute
span.setAttribute.[]{.setAttribute id attributes=values}.
Required Fields
- A set of attributes to be passed to the SVG element for styling (color, width, etc.).
econ Dataset
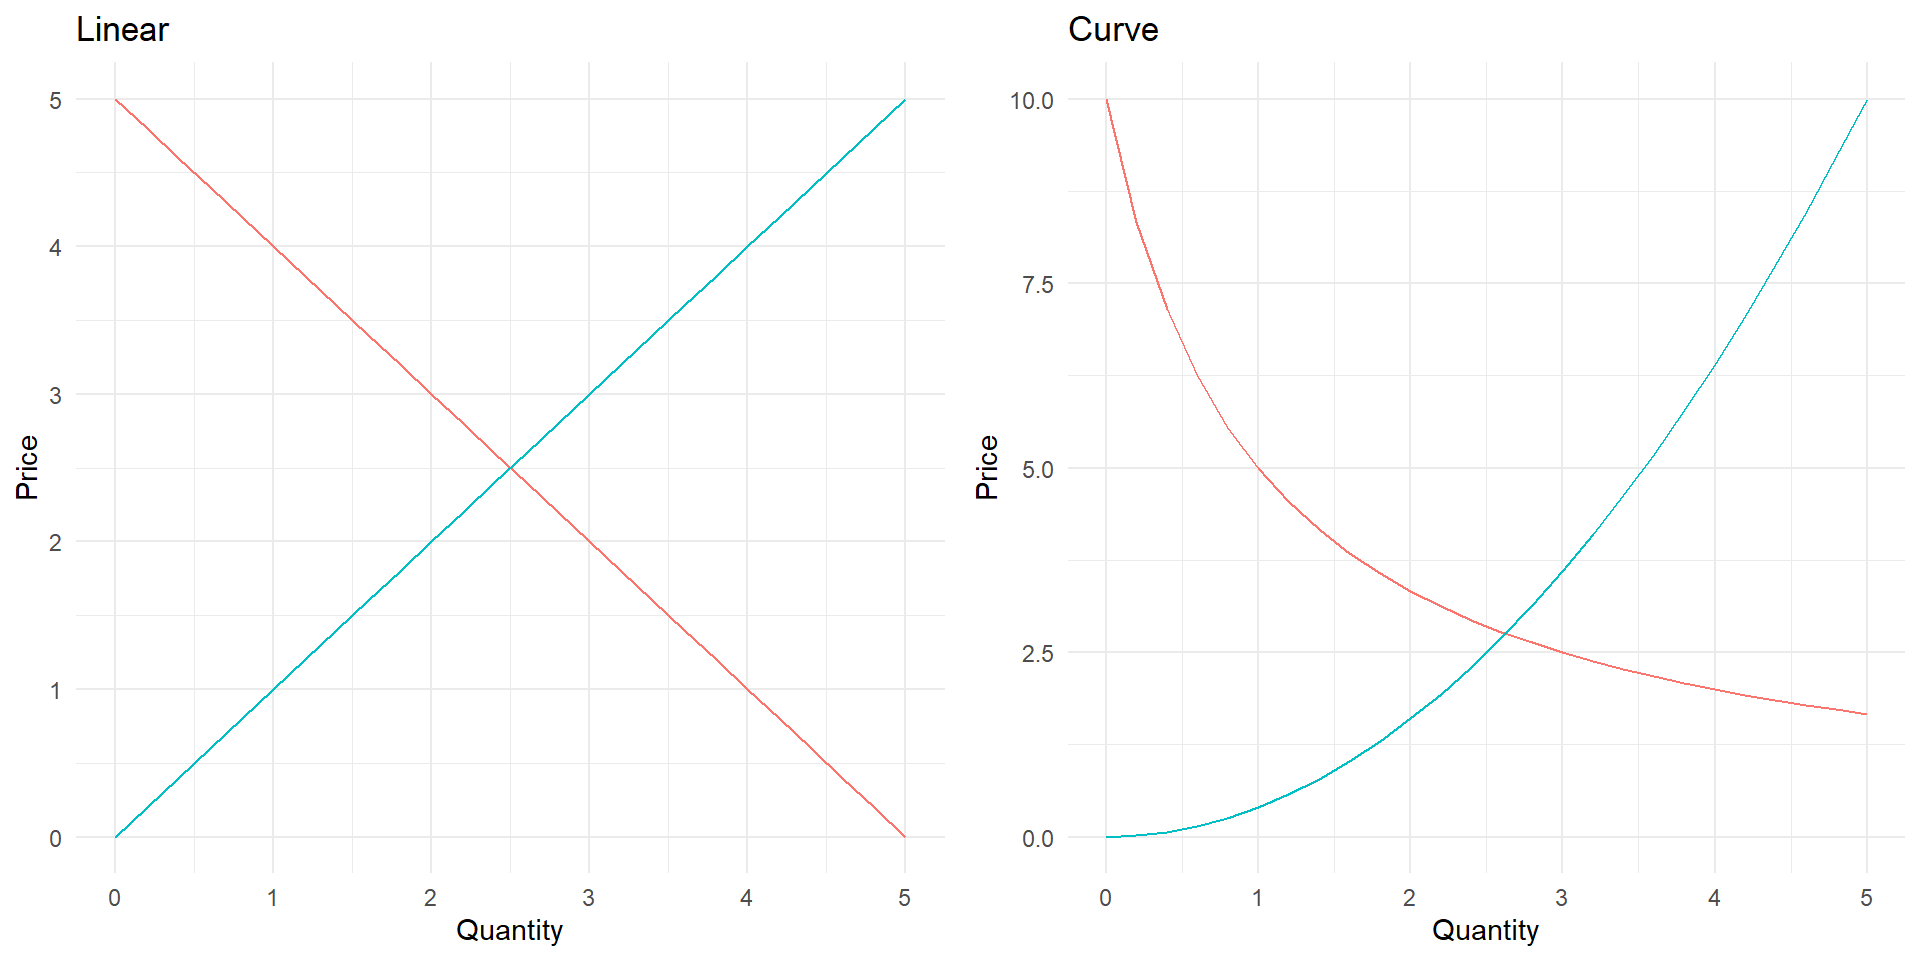
econ dataset allows users to draw supply and demand curves. Below is the name of the variables available in the dataset. Deman is actually an inverse demand (price as a function of quantity).
quantity: equally spaced grid on the x-axis between 0 and 5.demand: downward sloping linear line.supply: upward-sloping linear line.demandCurve: downward sloping convex function.supplyCurve: upward sloping convex function.*_right: right-shifted version of demand and supply*can be supply, demand, supplyCurve or demandCurve.*_left: left-shifted version of demand and supply (linear or curved).
Math Expressions
- Math expressions may be used if KaTeX is loaded.
- Please add
html-math-method: katextoformat: revealjsin the yaml of your file. - Or see math plugin for Revealjs.
- Please add
Example
- Here is the source code for a minimal example: example.qmd.
- Here is a slides on plug in explanations.